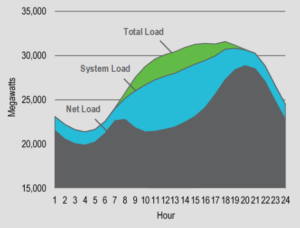
An interesting study about the ‘duck curve’ in California is out over the weekend from consulting firm ScottMadden. The point that intrigued me was the impact on the duck curve came from utility scale solar and not distributed resources. The data that creates this conclusion is the difference between the system load and net load. The duck curve is clearly visible in the net load but the system load is far more in line with the total load. More analysis should be done on this but if there continue to be more reports to this effect, solar may have additional information to use during net metering debates.


